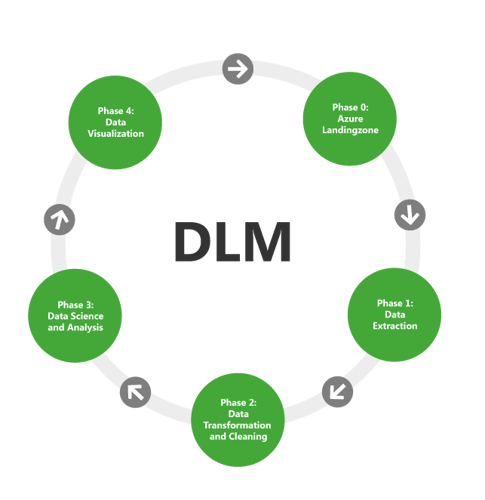
Data is arguably one of the most valuable elements within an organization. For example, data can tell you what your customer journey looks like. It can be fundamental in predicting scenarios and outcomes or help you respond to events as they happen automatically. However, opportunities also come with challenges. Getting insights from data entails more than just picking the suitable model and tool for the job. What your data journey looks like depends on your use case. Nevertheless, within any data project, there are five generic steps that any company will take to get insights from their data:
- Phase 0: Azure Landing Zone
- Phase 1: Data Extraction
- Phase 2: Data Transformation and Cleaning
- Phase 3: Data Science and Analysis
- Phase 4: Data Visualization
This article explains what these 5 data journey phases entail and what tools can be used within Azure to get the job done.
Phase 0: Azure Landing zone
Your first station will be the Azure Landing Zone. In your Azure Landing Zone, all required resources are created. Within this step, we will take special care to think about the security of your environment. Intercept applies a mindset of "Security & Compliance First." This means that guard rails are implemented, continuously enforcing the desired configurations. We do this by deploying three technologies:
- Policy
- Role-Based Access Control (RBAC)
- Infrastructure
We summarize these technologies in a so-called Azure Blueprint. This Blueprint is your' Landing Zone.'
Phase 1: Data Extraction
Once Intercept has put your Azure Landing Zone in place, we are ready to think about the next station: Data Extraction. Data sources are offloaded to a storage medium of your choice during this step. Here, you will decide to offload your data in batch or as a stream. Under batch processing, data is gathered over a set period and stored together. With streaming, information is sent to a storage medium at the moment of arrival.
With Intercept, we can advise on many often-used data extraction tools, like:
Phase 2: Data Transformation and Cleaning
In most cases, raw data is not ready for usage as is. Very often, raw data contains errors. Think, for example, of data containing missing values or duplicates. Maybe the data even needs to be aggregated over a certain period. In addition, it could be necessary to join your data to other data sources for it to make sense. Lastly, we will consider the storage format (CSV, JSON, Avro, Parquet, etc.) to ensure your data is processed efficiently throughout your data journey.
Whatever needs to be done, your users must know what to expect from your datasets. Therefore, we will also agree upon data- and documentation standards in this step. Data standards and documentation are hugely important as it promotes consistency throughout your datasets. Consistency will ultimately improve the quality of your data products in a later phase of your data journey.
With Intercept, we can advise on many often-used data transformations and cleaning tools, like:
Phase 3: Data Science and Analysis
In the Data Science and Analysis step, we transform your data into valuable insights. Data Science and Data Analysis enable you to make informed decisions based upon your data. Within this step, there are options aplenty! Data science and analysis don't always mean creating complex models. It can be as easy as writing a few queries to get insights from your data or as difficult as creating complicated machine learning models.
With Intercept, we can advise on many often-used data sciences and analysis tools, like:
Note: It's not mandatory to implement this phase within your data journey. It's possible to add the Data Science and Analysis step later or skip it altogether.
Phase 4: Data Visualization
When your data infrastructure is in place, you might find yourself needing to share your data with others. We help you make sense of your data within the Data Visualization step by using visual elements. Think, for example, of graphs, charts, and maps.
With Intercept, we can advise on many often-used data visualization tools, like:
Note: The Data Visualization phase can be implemented after Data Transformation and Cleaning (phase 2) or Data Science and Analysis (phase 3). If you don't currently have a use case for data visualization, this is fine! We can add Data Visualization to your solution later or skip it altogether.
Data Storage Tools
Throughout your data journey, you can store data in a storage medium of your choosing. Azure has many data storage options to choose from. Nonetheless, not all storage solutions are suitable for all use cases. Not sure which one is right for you? With Intercept, we can advise on many often-used storage solutions, like:
Let's Hop on the Intercept Train Together!
You might be asking yourself: how soon can my train be cleared to leave? With Intercept, we are always ready to start your data journey! Hop on the Intercept train and let us be your guide in data. We can take care of your entire data journey or just a few phases.
In 2022 we will launch all our data possibilities. Are you curious to start now? Contact us to check how we can help.