Blog Azure Cloud Native

AKS Monitoring: Key Concepts, Tools, and Best Practices

Monitoring in AKS can be complex, as microservice-based applications typically involve many moving parts in a single application.  

If any part of the system isn’t monitored, you lose insight into the application, making it harder to understand application behaviour or troubleshoot issues. 

In this article, we give you a high-level overview of the possibilities of monitoring AKS clusters and workloads using Azure-native and third-party tools.

Niels Kroeze

Author

Niels Kroeze IT Business Copywriter

Reading time 11 minutes Published: 25 September 2025

What is AKS Monitoring? 

AKS monitoring is the process of collecting, analysing and acting on telemetry data of Azure Kubernetes Service (AKS) clusters to ensure performance, security and reliability. 

Diagram illustrating Azure Kubernetes Service observability, showing data flow from containers, AKS, and OS to metrics, logs, and diagnostic logs, with outputs for insights, visualization, and response.

By monitoring in AKS, you can understand and keep track of the health and performance of your system. It enables you to detect anomalies (such as failing containers) and troubleshoot issues before they impact your application(s) and users. 


Why should we monitor at all? 

Suppose you have built a web shop application and divided it into different microservices (small pieces of processes), such as a microservice to place items in an order, a checkout process to finalise the order, and a payment process to enable customers to pay for the items.  

Each microservice of this application is pivotal in the proper functioning of your web shop. But what if one of these microservices fails in your application and you don't realise it?  

Your company will lose customers because they will order elsewhere. And because your web shop is not available, you lose money to the competitor. So that’s why monitoring can help you.  

Monitoring tells you something about:

  • The availability of your application
  • The health of your infrastructure
  • The performance of your applications

And ultimately, the health of your business. 

The key is to monitor your services before problems arise, not after.

Key AKS monitoring concepts 

AKS monitoring collects and analyses metrics and logs to track cluster performance, security, and reliability. Main data types include:

Monitoring data type Description
Platform metrics CPU, memory, disk I/O, network throughput for cluster and node health.
Activity logs Cluster actions and events, like creation, configuration changes, scaling.
Resource logs Control plane operations: API server, node lifecycle, scheduler; helpful for troubleshooting.
Container Insights metrics Container/pod metrics: CPU/memory, restarts, application logs, stdout/stderr streams.
Prometheus metrics Customisable metrics from workloads and system components for advanced monitoring.


AKS Monitoring Tools 

To help customers with their AKS monitoring activities, Microsoft offers several native monitoring and logging tools to help you get started. 

You can choose or combine the following monitoring and logging solutions in Azure: 

  • Azure Monitor for Containers (Container Insights) 
  • Log Analytics 
  • Application Insights 
  • Managed Prometheus 
  • Managed Grafana 

And that’s just the tip of the iceberg; there are even more ways available to monitor your AKS environment. For now, let’s start with Azure Monitor: 


Azure Monitor LogoAzure Monitor 

Azure Monitor is a suite of monitoring services that provides monitoring capabilities in your infrastructure as well as applications.  

Azure Monitor collects data; metrics, logs and traces – not just from your Azure platform but also external services. It can also monitor applications running on other platforms, such as on-premise, hybrid cloud, or multi-cloud environments.  

This gives you a centralised place to collect everything you need. It serves as the foundation for other Azure monitoring tools, such as Application Insights and Container Insights. Once data is collected, Azure Monitor provides insights and offers ready metrics to help you analyse and maximise the availability and performance of your applications and services. 

Container Insights 

Container Insights (known as Azure Monitor for Containers) is specifically for monitoring your container workloads. It provides clear visibility into the health and performance of your AKS nodes and workloads. This helps you detect issues quickly and keep your application stable.  

Container Insights uses Azure Monitor under the hood. The data it collects is stored in a Log Analytics Workspace, and visualised through dashboards: Container Insights → Log Analytics Workspace → Azure Monitor → Dashboards/Alerts 

Container Insights is the go-to tool for an overview of your AKS cluster’s infrastructure health and performance.  

With Container Insights, you can see: 

  • CPU and memory usage 
  • Node conditions 
  • Container logs, including standard output (stdout) and standard error (stderr) 


Azure Log Analytics logoAzure Log Analytics 

In Azure Log Analytics, your Azure Monitor agent collects, sends and stores your logs, traces and metrics. In Log Analytics, you can check: 

  • Query performance and health data 
  • Create alerts and dashboards 
  • Use built-in workbooks for fast insights 

It works through something called a Log Analytics Workspace. 

Azure Log Analytics Workspace is a centralised log management service It enables you to query and correlate the logs from different sources, using KQL (Kusto Query Language). 

Here, you can aggregate the logs and investigate issues based on specific parameters that it captures.  

Tip: Use a single Log Analytics Workspace 

Avoid creating multiple Azure Log Analytics Workspaces for your AKS nodes and resources. This way, you will have a unified view of all logs within your environment, as all logs are consolidated in the same Azure Log Analytics Workspace. 

Azure Application InsightsAzure Application Insights 

Azure Application Insights is an application performance monitoring service specifically designed for the applications that you run in the cloud. 

Application Insights is a very comprehensive and robust tool, which helps you as an infrastructure engineer or architect to see what's going on. Also, for app developers, it is very helpful to see if there's an application-specific error, where it occurred, and what caused it. For example, if a latency issue between components of your application arises, you will see it in Application Insights, as it collects all the data. 

This makes it a go-to tool when you encounter issues in your application in production, and it’s especially suited for troubleshooting problems ASAP. 


Azure Managed Prometheus and Grafana Services 

A combination that is often used is Prometheus and Grafana, which are both open-source solutions.  

  • Prometheus: a time-series database or metric server. 
  • Grafana: used to visualise metrics from different data sources, including Prometheus. 

They’re both natively integrated into Azure Monitor and Application Insights, which is why they can be considered as first-class tools for monitoring in Azure, especially for AKS, for monitoring and observability.


Azure managed prometheus logoAzure Managed Prometheus 

Prometheus, as the second-oldest project in CNCF after Kubernetes, is the de facto monitoring solution for cloud-native and containerisation. This is why Microsoft created its solution for Prometheus running on Azure: Azure Managed Prometheus. 

Managed Prometheus integrates seamlessly with: 

  • Azure Monitor workspace (for storage and querying) 
  • Azure Managed Grafana (for visualization) 
  • PromQL (for querying) 
  • Prebuilt dashboards and alert rules (for AKS and Kubernetes workloads) 

You can use this managed service to monitor things like the cluster autoscaler and retain your metrics data over the long term. It's a strong option if you need observability at scale without the operational burden of running Prometheus yourself and comes with these key features:  

  • Preconfigured alerts and dashboards 
  • Support for Horizontal Pod Autoscaling 
  • Custom scrape configurations via ConfigMaps 
  • Remote write support for self-managed Prometheus 


Azure Managed Grafana logoAzure Managed Grafana 

Azure Managed Grafana integrates tightly with Azure Monitor and Prometheus. With Grafana, you can create pre-built and custom dashboards using PromQL and it supports dashboards from: 

  • Azure Monitor 
  • Prometheus 
  • Azure Data Explorer 
  • Custom JSON imports 
Note:

Grafana integrates with Azure Monitor alerts and supports Prometheus alert rules for AKS. 

It also offers integration with Microsoft Entra ID (formerly Azure Active Directory) for access control. 

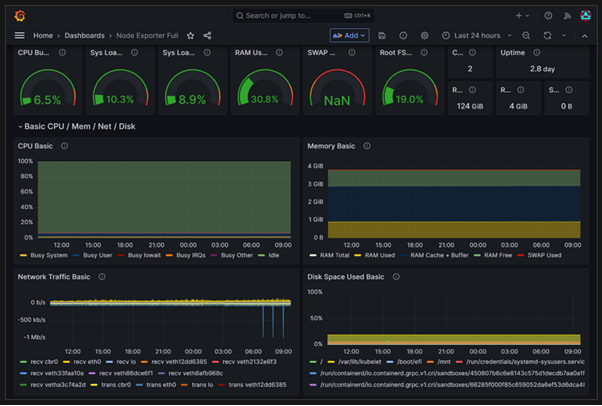
You can find a large community developing dashboards for Grafana, as well as information on how to import these dashboards into Grafana.  

Learn here how to use Azure Managed Grafana.


Other AKS Monitoring Options 

If you are already using tools such as New Relic, Datadog, or Dynatrace, these can also be integrated with AKS. Most of these platforms offer exporters or native support for Kubernetes clusters. If you prefer to deploy Prometheus and Grafana manually using Helm, this is also possible. However, in that case, you are responsible for setup, scaling, and security. The managed Azure versions take care of these aspects for you. 

Microsoft Defender for Containers is a cloud-native security solution for containerised environments. It helps you monitor, secure, and manage the security of your Kubernetes clusters, nodes, workloads, container images, and registries, across Azure, other clouds, and on-prem.


Which AKS Monitoring tool should you choose? 

By now, you know Azure provides endless opportunities and tools to monitor your AKS environment. The right solution depends on your specific needs and use case. That said, you don’t have to choose just one because there is no single monitoring tool that fits every AKS setup entirely.  

For example:  

  • Prometheus managed service can be used to collect metrics from the AKS, 
  • It exports them to Azure Log Analytics or Azure Monitor workspace. 
  • You can then run queries or build dashboards in Grafana to visualise those metrics. 
  • Then, Application Insights SDK will allow developers to instrument their application to get as much insight as possible from their application. Next, the data can be visualised in Application Insights or other supported tools. 

As you can see from this example, combining the right tools tailored to your situation is often a wiser approach. Therefore, consider what’s needed for your application, where each tool can help, and how they can complement each other. Also, remember that these monitoring solutions can be very costly, so be sure to use only what’s needed. 


AKS Monitoring Best Practices for Cloud-Native Observability 

Use distributed tracing 

With distributed tracing done correctly, you can understand how requests flow through your microservices and capture the critical pieces of tracing that you want to have in your application. 

Automate Alerts 

If you want to track and monitor specific anomalies, such as determining if a virtual machine's CPU is running at 95% for more than 30 minutes, you can set up an automated alert to notify you. Once you have your key metrics in place, you can create automated alerts for anomalies or thresholds and notify your customer or SRE team about specific critical issues that require their attention. 

Automate Responses 

After alerts are in place, the next step is to automate responses. Automation can significantly reduce response time. However, you must test it thoroughly and introduce it gradually to avoid unexpected outcomes. 

Centralise Log Management 

The best practice is to make sure you have centralised log management and collection; a single pane of glass. Only then will you be able to view and understand what’s going on in your system (including real-time logging and alert information).  

For example: For your workloads, you can use a single Azure Log Analytics Workspace to centralise all your logs, metrics, and traces. Then, setting up alerting and all the essential managed services to be on top of what’s happening in your environment. 

Leverage Visual Dashboards 

Once you collect the logs, you need to put them to use. That’s where dashboards and visualisation come in. It will empower others to understand what's happening in the environment, enabling them to reach the appropriate teams to address the issue, outage, or other system-related issues as quickly and efficiently as possible.

You can utilise the Managed Grafana service for both pre-built and custom-made dashboards.  

Diagram illustrating various Azure container services including App Service, Kubernetes Service, Virtual Machines, Container Instances, Container Apps, Functions, Service Fabric, Red Hat OpenShift, and Spring Apps.

Alternatively, you can create your own workbooks with Azure Monitor Workbooks, tailored to your specific monitoring requirements. 


Getting started with AKS Monitoring 

AKS doesn’t enable monitoring tools by default. That is to say, you must turn on some of these yourself

Before enabling monitoring features on your AKS cluster, you’ll want these command-line tools installed to manage your cluster effectively: 

  • Azure CLI: The Azure CLI is a set of commands used to create and manage resources. You can download it here and it is available for Windows, Linux, and macOS environments. 
  • kubectl: To manage your AKS cluster, you will have to work with the command-line tool kubectl. You can download this tool from here. It’s also available for macOS, Linux, and Windows environments. If you want to start or get familiar with kubectl, check out the kubectl quick reference. 
  • Helm: It helps you manage Kubernetes applications. Helm Charts help you define, install, and upgrade even the most complex Kubernetes applications. You can download Helm from here, and it is available for Linux, Windows, and macOS. 

Alternatively, you can manage resources through the Azure portal. 

After setting up these tools, enable monitoring: 

Enable Container Insights 

az aks enable-addons \
  --addon monitoring \
  --name my-cluster \
  --resource-group my-resource-group \
  --workspace-resource-id /subscriptions/<subscription-id>/resourceGroups/my-resource-group/providers/Microsoft.OperationalInsights/workspaces/my-workspace

Enable Prometheus-based monitoring 

To use Azure’s managed Prometheus service, add the --enable-azure-monitor-metrics flag. For example: 

az aks create/update --enable-azure-monitor-metrics --name <cluster-name> --resource-group <cluster-resource-group>


Set up alerts 

Once Container Insights or Prometheus is enabled, go to the AKS console → Alerts. You can: 

  • Create custom alerts via the Create button 
  • Turn on recommended alerts via Set up recommendations 


Closing thoughts 

If you want your applications to remain available, you need to implement monitoring. 

As with many things, setting up monitoring requires time and effort. It is best to include the implementation of monitoring into the design or development of your application, and to refine and improve it continuously within your DevOps process.

By following the best practices we’ve discussed, you can enhance the scalability, performance, and observability of cloud-native services that you run for your customers. Again, there’s no one-size-fits-all approach to monitoring AKS; numerous possibilities and tools are available on the market.  

Which tools will you use to monitor your AKS environment? 

Marc Bosgoed

Get in touch with us!

Intercept wishes you good luck with implementing monitoring, and if you have any questions, feel free to contact us.