Blog

What is DevOps Observability and why does it matter?

DevOps Observability has gained traction in recent years. It helps teams quickly find and fix issues in fast, distributed systems. Real-time insights from observability tools can reduce mean time to resolution (MTTR) by up to 53% and downtime by up to 50%.

Enterprises need high-quality telemetry data (metrics, logs, events, and traces) that provide accurate, detailed, and fully linked insights across all applications and infrastructure. So, they can meet modern demands and release software quickly. 

This is why observability is vital in DevOps. But what does it mean, and how can it benefit your business?

Niels Kroeze

Author

Niels Kroeze IT Business Copywriter

In this article, we’ll discuss the following:

Let’s dive in!


What is observability in DevOps?

In DevOps, observability is the practice of gaining real-time and valuable insights into the internal state of applications and infrastructure. This is done by analysing data from external outputs, like:

  • Logs
  • Metrics
  • Traces

It goes beyond application monitoring. It collects, analyses, interprets, and visualises telemetry data. This gives you a deeper understanding of how applications behave in complex systems and distributed environments.

Observability helps DevOps teams quickly find and fix issues, improve performance and prevent incidents by giving you a complete view of how systems behave under different conditions. 

A system is said to be observable if teams can quickly troubleshoot, diagnose the root cause, and resolve issues. The data must provide clear insights into how the system and its dependencies work.

“The higher the level of observability a system has, the quicker we can find the root cause when we get notified about an issue.”

This is especially important in complex environments where issues can be difficult to replicate.

Now that we understand what observability is, let’s explore why it’s so important for modern DevOps.


Why is observability important in DevOps?

In today’s distributed, microservices-based applications, traditional monitoring alone often isn’t enough. And with the growing pressure of increasing the time of software releases, things can go sideways instantly.

Observability is crucial as it allows teams to better understand system behaviours, essential to continuous deployment and high-paced development environments. It plays a vital role throughout the entire software development lifecycle, providing continuous insights into system health and performance. This is key for maintaining system performance and quickly resolving issues as they arise.

Also, it helps developers to be more efficient, reducing response and downtime and improving user experience. Without observability, it’s tough to understand why a system failed or how to fix it.


Monitoring vs Observability: what are the differences? 
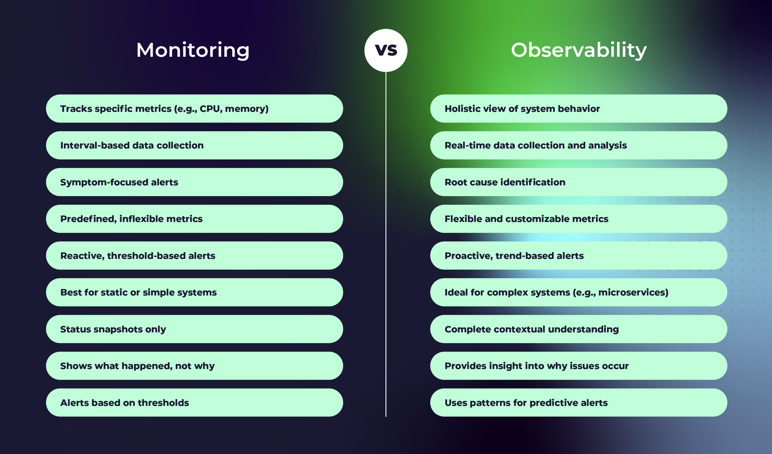
monitoring vs observability differences

They relate to each other. But, they serve different purposes for system health. Let’s explore both definitions to understand the difference.

Monitoring focuses on collecting and analysing data regarding system components. Monitoring systems include memory and CPU usage, network traffic, error rates, and latency. We set up alerts to better understand performance and to spot issues before they become bigger problems. This allows teams to identify and address issues like low CPU resources or slow service before they escalate.

Example: By monitoring the average response time of a specific service, like a search feature in an e-commerce app, teams can set alerts when performance dips below a certain threshold. This allows teams to address issues before users experience a problem. But getting notifications alone isn't always enough. 

When an issue arises, developers need sufficient data to detect the root cause completely and apply a permanent fix instead of using random fixes that waste time and resources. This is where observability comes into the picture.

Observability goes further by helping teams comprehend why the error occurred (the root cause) and how to get rid of the issue. We can describe it as a broader concept that includes monitoring.

The key difference: monitoring tells you something is wrong. Observability helps you understand why and how to fix it.

For example: a monitoring tool might tell us that our application response rate is no longer fast. But, with observability, we can figure out which specific microservice within the application is causing the problem and apply a permanent fix.

When combined, monitoring and observability enable a proactive approach to system health. Monitoring detects issues, while observability provides the insights necessary for resolving them. Together, they enhance teams’ ability to deliver a reliable, high-quality user experience.

3 Pillars of DevOps observability

the 3 pillars of DevOps Observability

There are three pillars of observability in DevOps which are:

  • Metrics
  • Logs 
  • Traces

So what do these mean? Let’s explain it in simple words.

Metrics

Metrics are (quantitative) numerical data that provide you with real-time insights into the performance of your application over time, such as:

  • CPU usage
  • Response times
  • Memory consumption
  • Error rates
  • User sessions 
  • Network traffic

If metrics show anomalies, it signals the teams to investigate further. For example, checking system metrics like Memory consumption or CPU usage will help you know if your app is running as expected.

Example: In an e-commerce app, high-traffic events, like Black Friday, may slow response times. This could hurt the user experience. By looking at these metrics, teams can identify resource bottlenecks and add more resources to handle the load so users can check out smoothly. 

Logs

The second pillar in DevOps observability is logs, also known as log messages. These are chronological, detailed and time-stamped records of events or transactions happening in a system or application. 

In other words, logs tell you who, what, when, and where. They help you analyse the issue and find its root cause. This can be a query that took too long, a failed API request, an unauthorised access attempt or an error in a payment processing step.

Log examples might include:

  • Security logs
  • Infrastructure logs
  • Application logs
  • System logs
  • Network logs

Logs capture every action taken by the system. When something goes wrong, logs provide a trail to follow. For example, if an error occurs, looking at the logs will show you what happened just before the issue.

Example: In an e-commerce web app, you can identify slow queries by looking into the search service logs and then finding and fixing the root cause.

Traces

Traces follow the flow of requests through various services and components of a system. So you can pinpoint where issues are happening and troubleshoot. They are crucial for monitoring microservice apps. 

Examples of traces:

  • API Calls
  • Logins
  • Network requests
  • File uploads
  • Database queries

Example: In an e-commerce app, traces can follow a user’s request, from searching for a product to adding it to the cart, checking out, and completing payment.

By looking at this flow, teams can pinpoint where delays or failures are happening and troubleshoot these issues to keep the user experience smooth.

This can be a slowdown in the checkout service or an error in the payment gateway.

What are the benefits of DevOps Observability?

Benefits of DevOps Observability

Better system performance

By continuously monitoring system metrics during the software development lifecycle, teams can identify performance bottlenecks and fix them. This means better application performance. For example, response times may reveal slow database queries, CPU issues, or network congestion. These need optimisation to make operations run more smoothly and efficiently.

More team collaboration

Collaboration improves when everyone on the team knows what’s happening in the system. Observability lets developers, operations and even business stakeholders see how the software performs. It creates a team culture. When issues arise, teams can come together to solve problems instead of working in silos.

Proactive problem-solving

With real-time visibility into system behaviour, teams can catch anomalies before they become critical issues. For example, seeing unusual error rates early means you can intervene quickly to prevent outages.

Data-driven decisions

Access to telemetry data lets you make informed decisions about system improvements and resource use. Teams can prioritise changes based on actual usage and performance metrics.

Faster issue detection and response

Observability helps to speed up root cause identification when issues arise, with less downtime. For example, tracing a request can show you exactly which microservice is causing the delay. Logs, metrics, and traces give you context about system performance, errors, and request flows so you can isolate and diagnose issues quickly. This means lower MTTR and less downtime.

Better customer experiences

Observability lets teams manage application health proactively, so fewer disruptions affect end users. Faster issue resolution and better performance create a seamless user experience. So, customers see:

  • Fewer errors
  • Faster load times
  • More reliable service
Presentation Simon

Do you want to learn more about DevOps?

If you’d like to know more about the various Azure DevOps Services and how they can be of value to your company, join our free workshop.

I want to join the Workshop

Observability challenges in DevOps and how to overcome them

While observability offers many benefits, it’s not without challenges. 

Data overload

Observability creates vast amounts of data from logs, metrics, and traces from various sources. This may become overwhelming to process and analyse. You may get lost in a massive pile of data, so you should focus only on the key metrics and leave out irrelevant data. 

Imagine a popular e-commerce site generating 20,000 logs per minute. How do you determine what alerts to focus on when your log aggregation system screams at you about everything? 

Here are a few techniques to help:

  • Apply log, metric, and trace data management techniques like filtering and aggregation to reduce the noise.
  • Build custom dashboards that focus on key metrics.
  • Take advantage of automated filtering to silence noise.
  • Implement data retention policies to manage data lifecycle.

Existing tools

Implementing observability on top of your existing toolchain can be time-consuming and complicated. Many monitoring tools are not well-suited to handle the nuances of observability. You may need to replace them, or at least augment them with additional devops observability tools.

For instance, if you have a monitoring setup that you’re happy with except for logs, you may not want to throw that investment away. However, your monitoring software is likely not designed to handle trace data. 

Here are a few techniques to help you integrate observability incrementally:

  • Integrate only what you can for now and focus on a subset of your infrastructure or applications.
  • Look for third-party tools that integrate with your existing stack.

Security concerns

Observability data often includes sensitive info from various system parts. This raises privacy and security concerns. Ensuring that only authorised users have access and that data is securely stored and transmitted is critical. 

Metrics that track user sessions or API calls may expose customer data if not managed properly.

Here’s how you can avoid it:

  • Implement Role-Based Access Control (RBAC).
  • Encrypt data at rest and in transit.
  • Anonymise data.

Skill gaps

Observability requires a unique set of skills you may not have in your organization. You need people who understand distributed systems and how to instrument them with tracing. You need people who can interpret telemetry data and monitor systems. If you don’t have those skills in-house, you’ll need to acquire them or bring in people who do.

For instance, if you have a monitoring-centric team, they’ll need education and training on how to read trace data.

Here’s how you can address skills gaps:

  • Send them to workshops and certification programs.
  • Hire experts to get you started and educate the rest of your team.
Kickstart

Accelerate with Azure DevOps!

Our certified experts will help you set up, migrate, and support your journey with Azure DevOps, so you can focus on building great software.

Azure DevOps by Intercept

Observability tools in DevOps

Selecting the right observability solution is crucial for effective monitoring and performance analysis in complex systems. There are many monitoring and observability tools out there. Some popular ones are Prometheus, Apache Kafka, Jaeger and Grafana.

Let’s dive into each:


Prometheus logo

Prometheus

Prometheus is an open-source tool that collects metrics and alerts when something goes wrong. It’s super popular in Kubernetes environments because it’s so easy to integrate with container orchestration.

It has a powerful query language, PromQL, to create complex queries and aggregate data to get insights into system performance. Plus, it’s highly scalable, which is great for Cloud Native apps.


Apache Kafka

Apache Kafka

Apache Kafka is a distributed data streaming platform for real-time data feeds. It is great for collecting and processing observability data from multiple sources. Kafka handles large volumes of log, metric and trace data to get real-time insights into distributed systems. It’s a data pipeline so observability tools can consume and process the data.


Jaeger logo

Jaeger

Jaeger is an open-source tracing tool. Uber developed it to monitor and troubleshoot transactions across microservices. It’s great for distributed systems so teams can visualise and analyse request flows to see bottlenecks and dependencies. Jaeger helps you trace requests. It shows where latency issues or errors are from. This makes it easier to troubleshoot performance problems in microservice architectures.


Grafana logo

Grafana

Grafana is an open-source tool that visualises metrics, logs and traces from sources like Prometheus, Elasticsearch and more. It has flexible, customisable dashboards and visualisations. So, teams can monitor and analyse real-time performance data. Grafana supports many data sources and can be extended with plugins, so DevOps teams can build dashboards for their needs.


Choosing the right tool

Choosing the right observability tools is critical for the effective implementation of observability in DevOps. When selecting an observability tool, DevOps teams should consider factors such as performance, scalability, usability, and integration with existing tools and systems.

By choosing the right observability tools, DevOps teams can ensure that they have the necessary visibility and insights to optimise system performance and improve overall quality. These tools provide the foundation for a robust observability strategy, enabling teams to monitor, analyze, and enhance their applications effectively.


Closing Thoughts

Observability in DevOps is key to healthy applications and systems. Teams can spot issues and collaborate by focusing on logs, metrics, and traces.

Ultimately, observability aims to give enough context for effective troubleshooting when an issue arises.

To implement DevOps observability, set clear goals and metrics. Choose the right tools. And create a culture of collaboration between your development, operations, and monitoring teams.

We hope you’ve got a clearer view on this topic now.

Romy Balvers

Get in Touch!

Let's join forces on your cloud journey.

Frequent Asked Questions about DevOps Observability

What is an example of observability?

How does observability differ from traditional monitoring in DevOps?

What are the four golden signals of observability?

What is observability in Kubernetes?

What are the key metrics for observability?

What are the components of a DevOps observability platform?

What is observability in DevSecOps?