What is Azure Monitor?
Azure Monitor collects and analyses monitoring data from Azure, other cloud environments and on-premises systems.
In simple terms: it shows how your applications, resources and dependencies are performing. That makes it easier to spot issues early and act faster.
You use Azure Monitor for:
- Applications and APIs
- Virtual machines
- Containers and Prometheus metrics
- Databases
- Networking components
- Identity services
Azure Monitor also integrates with Microsoft Sentinel, Network Watcher, IT Service Management (ITSM), ticketing systems and visualisation tools.
Azure Monitor capabilities
- Detect issues with Application Insights.
- Monitor infrastructure and containers.
- Analyse data with Log Analytics.
- Set alerts and automated actions.
- Create dashboards and workbooks.
How Azure Monitor works
Azure Monitor works as a flow: data comes in, gets stored, is analysed and then turns into action.
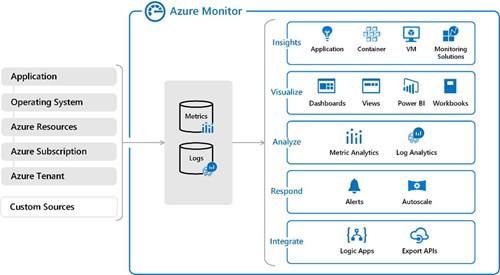
Azure Monitor is active as soon as you create a new Azure subscription. Activity logs and platform metrics are collected automatically.
That does not mean the setup is finished. You still need to decide which data to collect, where to store it and which actions should follow.
What data does Azure Monitor collect?
Azure Monitor collects data from different layers of your environment:
- Azure resources: metrics and diagnostic logs from virtual machines, databases, storage accounts, App Services and AKS.
- Applications: performance, errors, dependencies and traces through Application Insights.
- Guest operating systems: CPU, memory, disk and network data through the Azure Monitor agent.
- Subscriptions: changes such as resource creation, role assignments and configuration updates.
- Tenant-level data: identity and directory data through Microsoft Entra ID.
On-premises systems can also be included through agents and connectors.
Metrics and logs: the difference
Azure Monitor stores data mainly as metrics or logs. The difference matters.
- Metrics: fast numerical data, such as CPU, memory, latency and request counts.
- Logs: deeper data for analysis, troubleshooting and historical insight.
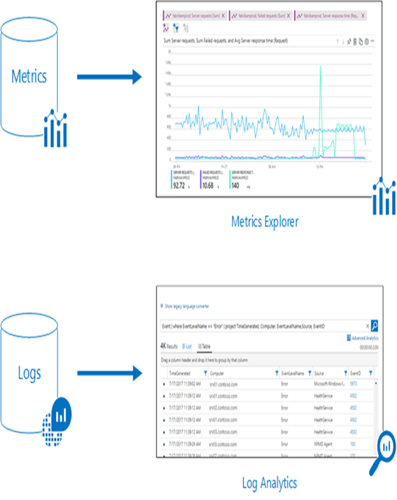
Use metrics for fast signals. Use logs for investigation and root cause analysis.
Visualisation and analysis
Azure Monitor helps turn raw data into useful insight.
- Dashboards: combine key data in one Azure Portal view.
- Workbooks: create interactive reports with text, queries and metrics.
- Power BI: share insights with stakeholders outside Azure.
- Metrics Explorer: analyse trends and performance quickly.
- Log Analytics: use Kusto Query Language (KQL) for deeper analysis.
For technical teams, Log Analytics is especially useful. It lets you filter, combine and correlate logs across multiple resources.
Alerts and actions
Monitoring only becomes useful when it leads to action.
With Azure Monitor, you can create alerts based on metrics, logs or activity logs. Examples include high latency, error spikes, resource changes or dependency failures.
Alerts can trigger action groups, such as:
- Email or SMS notifications
- Microsoft Teams notifications
- Webhooks
- Logic Apps
- Azure Functions
- Runbooks or ITSM integrations
This turns Azure Monitor into more than a dashboard. It becomes a response engine for operations.
Integrations with other tools
Azure Monitor can route data to other systems. That is useful for security, compliance, reporting or longer data retention.
- Event Hubs: send data to external Security Information and Event Management (SIEM) or monitoring tools.
- Azure Storage: archive monitoring data at lower cost.
- Partner tools: integrate with tools such as Elastic, Datadog, Logz.io and Dynatrace.
- APIs: build custom integrations for metrics, logs and alerts.
- Azure DevOps and GitHub: connect monitoring data to work items, releases and continuous monitoring.
Key benefits of Azure Monitor
- Azure Monitor delivers several key benefits that make it essential for modern cloud operations.
- Unified visibility: It provides a single platform for all your monitoring needs, eliminating the complexity of managing multiple tools.
- Proactive detection: Identify issues before they impact your users, reducing downtime and improving customer satisfaction.
- Deep analytics: Provides advanced querying and correlation capabilities that help you understand complex system behaviours and root causes.
- Hybrid support: Monitor both cloud and on-prem resources from a single place.
- Automation: Reduce manual intervention and speed up problem resolution with automated responses and remediation.
- Seamless integration: We love how Azure Monitor integrates with the broader Azure ecosystem and third-party tools, giving you flexibility in how you manage your monitoring workflows.
All in all, these benefits together make Azure Monitor a powerful foundation for maintaining reliable, higher-forming apps and infrastructure.
Azure Monitor best practices
Like any tool, Azure Monitor works best with structure. Most teams run into problems in one of two ways: they either collect too little and create blind spots, or collect too much and create noise and unnecessary cost.
Follow these best practices for monitoring in Azure:
Leverage Azure Policy for consistent configuration
Use Azure Policy to enforce consistent diagnostic settings across subscriptions. This makes sure resources send the right logs and metrics to the correct workspaces.
It also reduces blind spots and avoids the common problem of “it works in this subscription, but not in that one”.
Design your Log Analytics workspace strategy upfront
Workspaces are where good monitoring becomes manageable, or messy.
A few practical patterns that work well:
- Always separate production and non-production.
- Use separate workspaces when you need clear boundaries for billing, access or compliance.
- Keep naming and tagging consistent so teams know where data belongs.
Also make Role-Based Access Control (RBAC) part of the design. Not everyone needs access to everything.
Set threshold alerts, and make them actionable
Alerts should trigger action. If they do not, they create alert fatigue.
Build alerts around:
- Customer impact, such as failed transactions, high latency and availability checks.
- Known failure modes, such as a dependency being down, queue backlog or error spikes.
- Clear thresholds that match reality.
Use dynamic thresholds where it makes sense, especially when traffic is seasonal or still growing. And assign ownership. Every alert should have a clear “who responds”.
Optimise costs with ingestion and retention discipline
Costs usually rise because teams collect too much data and keep it too long.
Practical steps:
- Review ingestion volume monthly.
- Filter noisy logs you never use.
- Use sampling in Application Insights where appropriate.
- Set retention based on operational need, not habit.
- Export data for archive instead of keeping everything in hot storage.
- Optimise costs: Analyse ingestion rates for metrics and logs to avoid high costs. Use retention policies to manage log storage effectively.
- Set threshold alerts: Use dynamic thresholds in alert rules to adapt to seasonal or application-specific performance variations.