Common Azure performance issues (and what usually causes them)
1. Not choosing the right VM type
Azure has an endless amount of different VM types, all designed for specific needs. We often see customers that don’t know which SKU to choose. When the workload and the VM family don’t match, you end up paying more and getting worse performance.
Selecting the correct VM sizes is crucial to optimising both performance and cost-efficiency, as the right size ensures your resources are neither underutilised nor overprovisioned.
Common mismatch patterns:
- Memory-optimised VM doing CPU-heavy work
- General-purpose VM handling a high-IO database
- Under-sized VM where disk throughput is the real limiter
What to do instead:
- First, decide what you are actually running: CPU-heavy, memory-heavy, disk-intensive, or network-bound.
- Then check the ceilings. VM size and disk type cap the IOPS and throughput you can get.
- If latency between components matters, keep related resources close. Proximity placement groups can help reduce latency, but only if you use them intentionally (and do not assume they fix underlying bottlenecks).
2) Disk IOPS limitations
This one catches teams constantly. It looks like “Azure is slow” when the reality is “Azure is capping IO”.
Common symptoms
- High disk queue length or rising disk latency
- Writes slowing down first
- Latency getting worse as load grows
- CPU staying relatively low
Typical fixes
- Avoid Standard HDD for IO-heavy workloads
- Use higher tier disks when the workload demands it
- Reduce small IO operations by batching, caching, or redesigning hot paths
3. Network speed issues
Network problems are common in Azure, especially in multi-region setups, where there are more hops, more routing decisions, and more places for traffic to take a weird detour. However, single-region setups get hit too. This is particularly the case when routing, DNS, firewalls, or NAT are involved.
What causes network slowness most often:
- Poorly planned VNets (over-complex peering, UDRs forcing traffic the long way)
- Forced tunnelling through on-prem or an NVA that becomes the choke point
- Bandwidth limits or imbalanced paths that add latency
- DNS resolution delays (dependency calls feel randomly slow)
- NAT/SNAT constraints causing intermittent timeouts
- Load balancer distribution issues or health probe problems
Tools like Azure ExpressRoute (dedicated connectivity) and Azure Front Door (traffic routing) can help. But they still need to be configured correctly.
Using private endpoints, content delivery networks (CDNs), or traffic management tools can further reduce latency, optimize data paths, and improve connectivity for your applications.
4. File Share setup issues
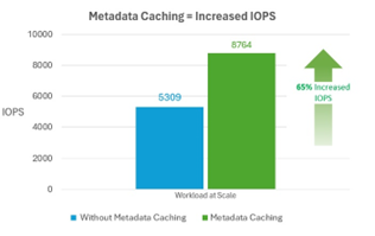
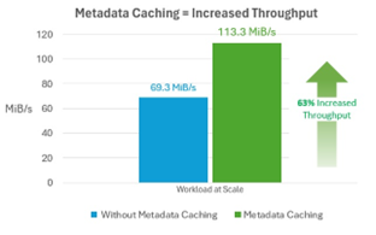
Misconfigured file shares often result in performance dips. Usually this is because the workload is more “metadata heavy” than you realised (lots of file opens, directory enumeration, small file operations).
One of the most useful improvements here enabling metadata caching: Microsoft states it significantly improves performance, boosting available IOPS and network throughput by more than 60% for metadata-heavy workloads at scale.
5. Wrong storage types
Using the wrong storage type can slow things down quickly. Standard hard disk drives are not suitable for input/output (I/O) heavy workloads. This is how you end up with systems that look fine in dashboards but feel sluggish under load: the app isn’t “slow”… it’s waiting.
6. Databases
Databases are often the bottleneck in distributed systems. Slow database performance often stems from resource competition.
If database resources are underprovisioned or queries are inefficient, performance drops. Scaling up database resources can help, but it’s rarely the best first move. Partitioning data can also improve speed when access patterns and contention demand it.
Typical fix areas include:
- Inefficient queries and missing indexes
- Contention (blocking, deadlocks)
- Plan changes after deployments
- Hitting service limits or throughput ceilings
7. Resource Cap Limits/quotas
Azure imposes limits on resources like IOPS, network bandwidth, and CPU usage. Hitting these caps can severely impact performance. Use Azure Monitor for regular tracking allows businesses to spot resource constraints early and scale up as needed, or fix the constraint so scaling is not the only option.
Azure’s VM Performance Diagnostics describes continuous diagnostics collecting data at short intervals and reporting insights frequently.
8. Configuration mistakes and change-related slowdowns
Configuration mistakes like incorrect routing or security policies can also cause delays. Automation helps reduce human errors, but manual changes without testing can introduce problems. Deploying updates during busy times without proper testing can slow down systems.
This is why performance is not purely technical. It is operational too.
Possible causes for application slowness
Use this checklist to make sure you are not missing something obvious.
| Resource constraints |
High CPU, memory, or disk utilisation on the Azure VM. |
| Network latency |
High latency between the client and the Azure VM, or between services inside Azure. |
| Application bottlenecks |
Inefficient code paths, slow algorithms, blocking calls, or poor connection management. |
| OS-level issues |
Outdated OS patches, drivers, kernel issues, or misconfiguration. |
| Infrastructure issues |
Azure service disruptions, platform incidents, or regional outages affecting dependencies. |
| Storage issues |
Disk fragmentation in some scenarios, insufficient IOPS, high disk queue length, rising disk latency. |
| Virtualisation layer |
Hypervisor-level contention and noisy neighbour behaviour impacting VM performance. |
| Security and firewall restrictions |
Policies or firewall rules blocking necessary traffic or forcing inspection paths that add latency. |
| Application dependencies |
External services or APIs causing delays, intermittent failures, or retry cascades. |
| Disk IOPS issues |
Insufficient IOPS affecting disk throughput and overall performance under load. |
Performance check tools
For teams managing Azure resources, regular configuration reviews, automation, and monitoring tools like Azure Monitor and Application Insights are vital.
- Azure Monitor: Azure Monitor is your go-to tool for system health and performance signals. Performance Diagnostics supports continuous and on-demand approaches for VM troubleshooting.
- Azure Application Insights: Application Insights allows you to monitor the usage and performance of your app in detail. Use it to see where the time goes:
- request duration
- dependency duration
- failure rates, retries, and correlation with releases
- Azure Advisor: Azure Advisor offers cost-saving and performance recommendations. It helps you spot inefficiencies early.
Best practices for Azure performance optimisation
You can fix performance issues once. Or you can set things up so they stop coming back. These practices do the second.
1. Measure the right things
Speed testing is useful when you measure what users feel and what the platform can sustain:
- p95 and p99 latency for user experience
- throughput for capacity
- saturation signals for bottlenecks (CPU, memory, disk, network)
Two tips that reduce false confidence:
- Test with realistic traffic patterns, not a single smooth ramp.
- Keep a baseline from “normal” weeks, so you can spot regressions after releases.
2. Set up performance alerts that people act on
After reviewing your data, configure alerts to catch problems early. Azure Monitor supports various alert types:
| Alert type |
Use case |
Key benefit |
| Metric alerts |
Resource usage tracking |
Monitors thresholds in real time |
| Log search alerts |
Pattern detection in logs |
Custom queries for detailed analysis |
| Activity log alerts |
Resource changes |
Tracks configuration modifications |
| Smart detection |
Application monitoring |
Flags potential performance issues |
To set up effective alerts:
- Choose metrics that directly affect performance and user experience.
- Set thresholds based on historical data.
- Define action groups for notifications such as email, SMS, or automated responses.
- Specify evaluation frequency and the time window for analysis.
This ensures timely notifications so you can address issues before they escalate.
3. Avoid over-provisioning without triggering incidents
To keep costs under control, avoid buying more resources than needed.
4. Right-size resources
Analyse VM usage. If a VM has less than 50% CPU utilisation, consider downsizing it to reduce costs. Note that you must always review memory, disk IOPS and SKU constraints, as these may still justify the current size. Test the smaller SKU first to confirm performance before committing.
5. Efficient storage management
Move rarely accessed data to lower-cost storage tiers to reduce expenses.
6. Put in cost controls
- Analyse usage patterns using Azure Cost Management to spot improvements.
- Set budget alerts at 80% and 90% of your set limit to avoid overspending.
- Enable autoscaling based on real usage, such as scaling down development environments during off-hours.
The goal is not “lowest cost”. The goal is predictable performance without paying for unused headroom.
Additional considerations
- Operational mistakes and security threats can also cause performance problems. Human errors like incorrect manual configurations or failed updates can disrupt services. Automation and strict change controls help prevent these issues.
- Monitoring is key. Without tracking response times, throughput, and resource use, issues can go unnoticed until they affect users.
- Proper scaling, whether by increasing resources or adding more instances, is essential during traffic spikes. Relying on manual scaling can cause delays, so autoscaling features should be used.
- Resilience features like redundancy and failover keep systems running smoothly even when parts fail. But they need proper setup and testing.
- Azure publicizes each service interruption or performance degradation, and the Azure status page offers a global view of the health of all Azure services in all regions. Stay updated with instant alerts for Azure outages by signing up for notifications and check the Azure status page: https://azure.status.microsoft/en-us/status
Closing thoughts
We’ve shown how a structured troubleshooting approach helps isolate the issue quickly and fix it efficiently.
Designing applications for scalability using appropriate resource types and planning for failures helps maintain good performance. Addressing performance issues is a mix of good planning, proper setup, and ongoing management.
When infrastructure, software, operations, and security are aligned, systems run efficiently and users stay happy.